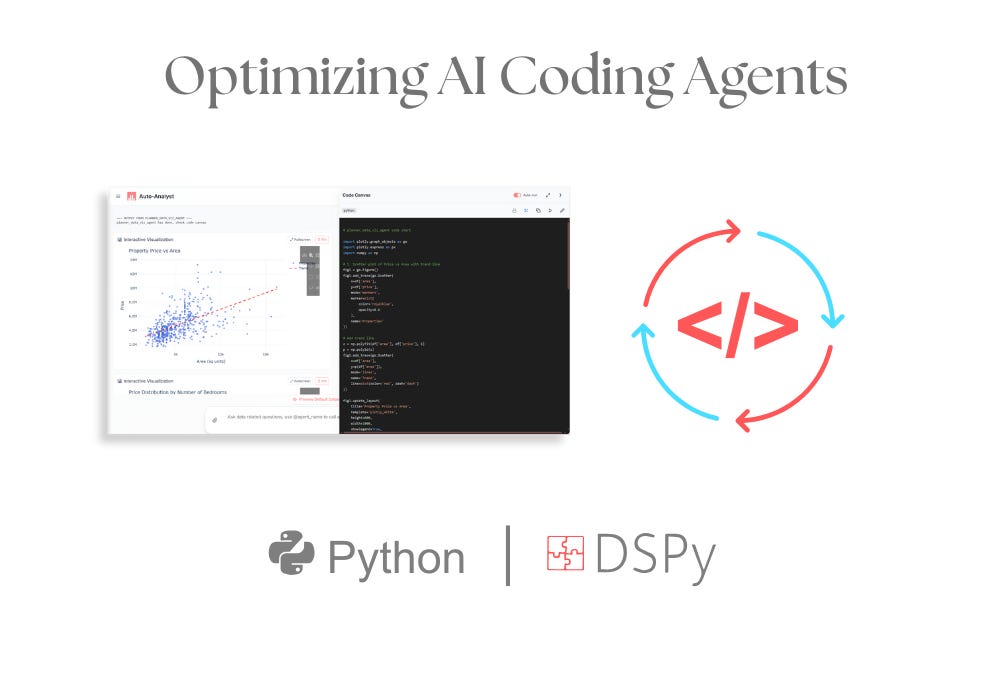
Tldr;
This blog post is a technical walkthrough of how we improved the coding agents used in the AI data scientist. With the actual data, and evaluation technique explained.
Watch the video version of this post, made using https://blog2video.app
It has the following portions:
- Preparing data
- Explaining GEPA
- Applying prompt optimization (GEPA) via DSPy
- Results
For a recap on the design of the system:
Preparing Data
The dataset is made up of python code execution runs done through our product. The auto-analyst is an AI system with multiple parts, each designed for a specific coding job. One part, the pre-processing agent, cleans and prepares the data using pandas. Another part, the data visualization agent, creates charts and graphs using plotly.
The system has about 12 unique signatures, each with two versions — one that uses the planner, and one that runs on its own for ‘@agent’ queries.
But for this blog post, we’ll focus on just 4 of those signatures and their two variants. These 4 alone make up around 90% of all code runs, since they’re the default ones used by almost everyone — whether they’re free or paid users.
- preprocessing_agent
- data_viz_agent
- statistical_analytics_agent
- sk_learn_agent
We can break the dataset down into two parts: the default dataset provided by the system and the data that users upload themselves.
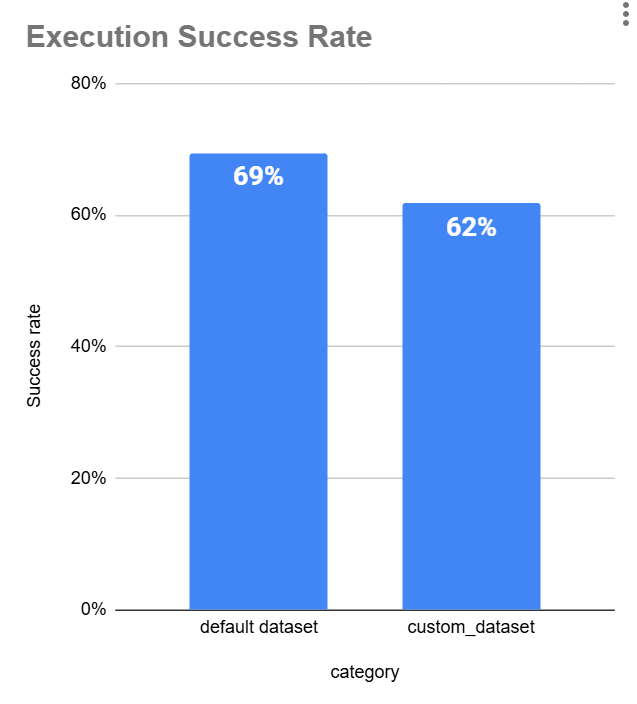
Code execution success rate by category
Our goal is to make sure any optimization improves performance on both. It should work well not just on the default data but also on the datasets users upload.
To do this, we need to stratify the data. That way, the model doesn’t overfit on the default dataset and can handle a variety of inputs effectively.
Another important factor we need to consider is the model providers. We don’t want to optimize just for one provider and end up hurting performance on the others.
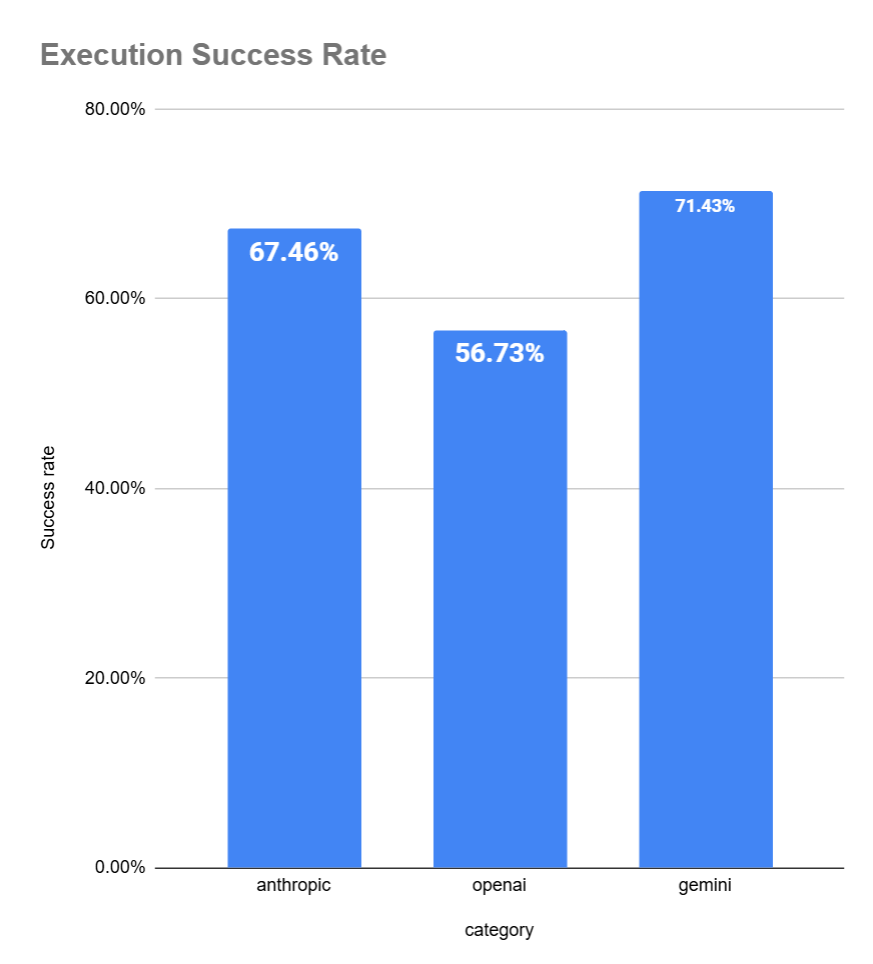
Note: There’s bias in this because our users mostly used OpenAI’s cheaper models like GPT-4o-mini in our system, while for Gemini our users used only their top models. Since we don’t have enough data to do the evaluation on a per model basis, we’re using the provider as a proxy. When comparing top OAI models with the top models of other providers, Openai’s success rate is similar.
After preparing the dataset, we created a stratified sample with the following constraints:
- No more than 20% of the data comes from the default dataset (
is_default_dataset == True). - Each of the three model providers (
openai,anthropic,gemini) is represented in at least 10% of the final sample. - Stratification was done across three columns:
model_provideris_successfulis_default_dataset
Once the stratified sample was created, we split it into a training set and a test set to be used for evaluation.
Looking for someone to implement AI evals and guardrails for you? Or to improve your AI system?
Reach out for help here: https://tally.so/r/3x9bgo
Explaining GEPA
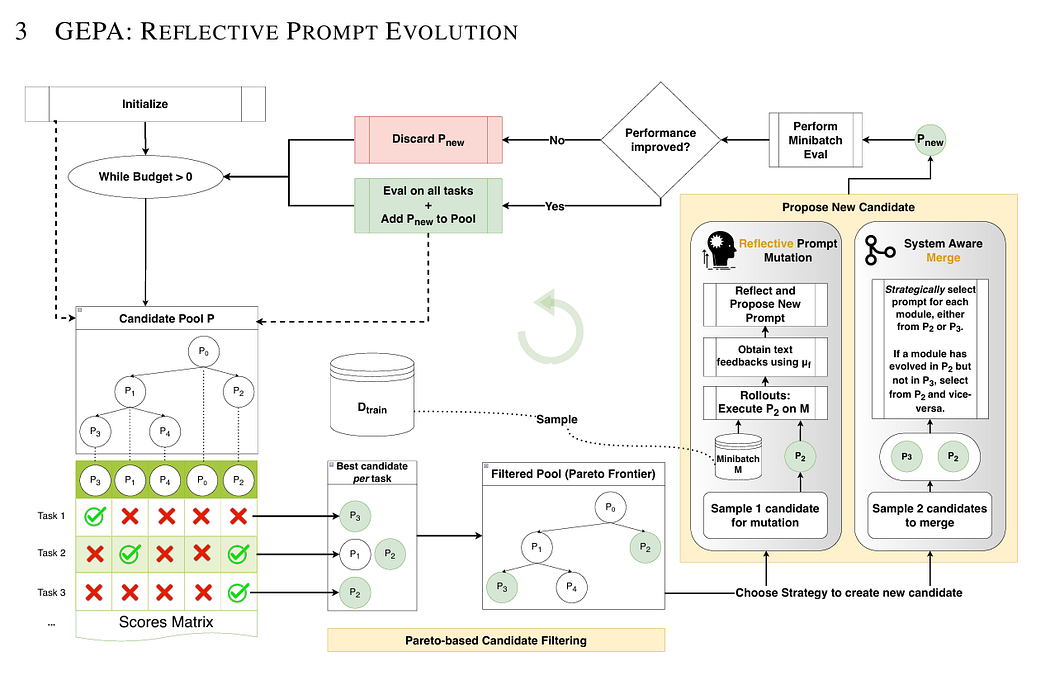
GEPA stands for (Generic-Pareto) is an evolutionary prompt optimizer designed for DSPy programs that uses reflection to evolve and improve text components such as AI prompts. GEPA leverages large language models’ (LLMs) ability to reflect on the program’s execution trajectory, diagnosing what worked, what didn’t, and proposing improvements through natural language reflection. It builds a tree of evolved prompt candidates by iteratively testing and selecting better prompts based on multi-objective (Pareto) optimization.
Step-by-step, here is what GEPA does as an evolutionary prompt optimizer in DSPy:
- Initialization:
- GEPA receives inputs: a compound AI system (with prompts/modules to optimize), a training dataset, an evaluation metric, a feedback function, and a rollout budget.
- It initializes a candidate pool with the base system as the first candidate and splits the training data into feedback and Pareto evaluation sets
- Evaluation of Initial Candidates:
- Each candidate system is evaluated on the Pareto set, producing a set of scores reflecting performance on different task instances.
- Iterative Optimization Loop:
- GEPA repeatedly executes until the rollout budget is exhausted:
- a. It selects a candidate from the current pool, focusing on those along the Pareto frontier (non-dominated candidates).
- b. It chooses a module (a prompt segment) within the selected candidate to optimize.
- c. Runs the candidate system on a minibatch of feedback data, collecting detailed feedback including outputs, scores, traces, and diagnostic information.
- d. Uses a large language model (reflection LM) to analyze this feedback and reasoning chains in natural language, trying to identify what worked, what failed, and how to improve the prompt.
- e. The LM proposes an improved prompt for the selected module by mutation and textual refinement.
- f. The system creates a new candidate by replacing the old module with the improved prompt.
- g. It evaluates the new candidate on the minibatch to check if performance improves.
- h. If improved, the new candidate is added to the pool and evaluated on the full Pareto set, updating the candidate pool and parent-child relationships.
- Candidate Selection:
- Selection favors candidates on the Pareto frontier to promote diverse high-performing solutions.
- Stochastic selection is used to explore promising candidates more frequently.
- Continuation and Convergence:
- The process continues iteratively, accumulating improvements over generations.
- It builds a tree of evolved prompt candidates showing the optimization trajectory.
- Output:
- The best-performing evolved candidate prompt configuration is returned after the budget is exhausted.
- This final prompt outperforms the base prompt significantly, as shown in benchmarks like AIME math problems.
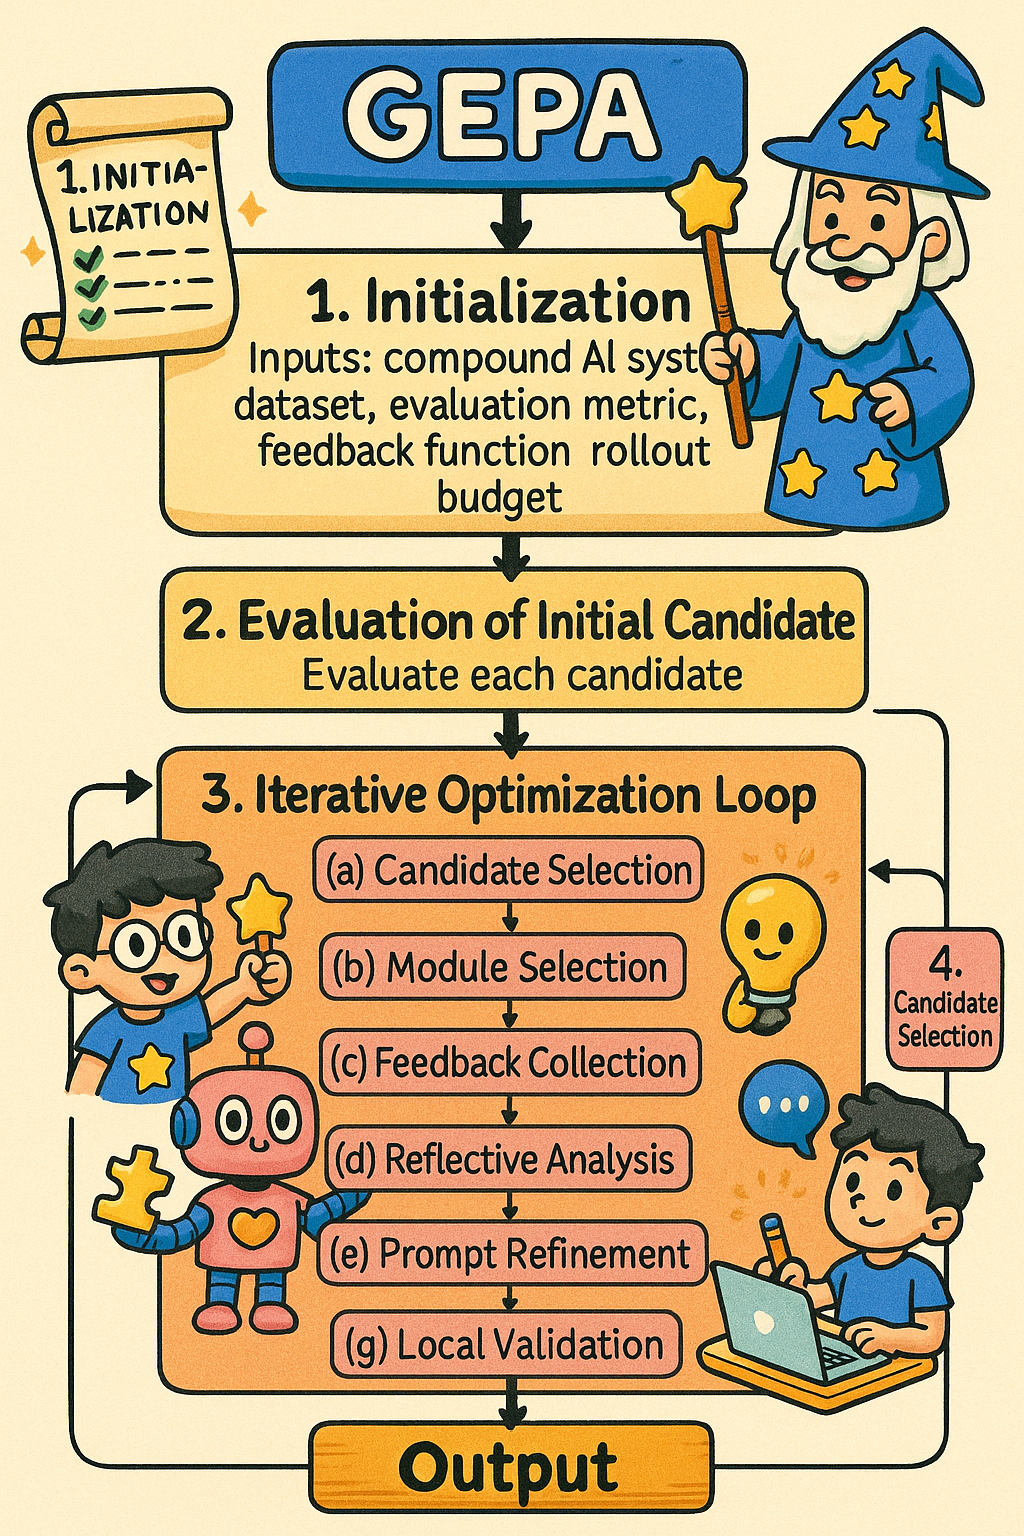
In summary, GEPA uses LLM-based reflective natural language reasoning on prompt execution feedback to evolve prompts via an evolutionary algorithm with Pareto optimization, while being constrained by a budget.
Here are some resources for an Indepth technical introduction to the concept:
- Original Paper: https://arxiv.org/pdf/2507.19457
- Videos by Connor Shorten:
- DSPy implementation guide: https://dspy.ai/api/optimizers/GEPA/overview/
Applying GEPA to Auto-Analyst — a practical example
The autoanalyst and its components are already defined as DSPy modules and signatures.
Since we don’t store user datasets (by policy), the only information available is the context passed to each agent. To work around this, we need to recreate a “mimic” dataset with the same columns, inferring data types from the descriptions.
An LLM can then be used to generate synthetic dataset context, which we can wrap into a dummy data frame for execution.
pythonclass create_synthetic_context(dspy.Signature):
“”“
You are tasked with generating a synthetic pandas DataFrame that mimics a user’s dataset.
The dataset should be inferred from the agent’s code and the provided error message,
since the real user dataset is unavailable.
Instructions:
- Carefully analyze the `code` and `error_message` to identify what columns, datatypes, or shapes the dataset likely has.
- Identify the DataFrame variable name from the code (e.g., df, data, customers, train_data).
Use that same variable name in your output instead of always defaulting to `df`.
- Infer column names from any DataFrame references (e.g., data[’age’], customers[”salary”], train_data[”city”]).
- Infer datatypes based on column names and context:
- If numeric (e.g., “age”, “salary”, “score”, “amount”), use integers or floats.
- If categorical (e.g., “gender”, “city”, “department”), use short string categories.
- If datetime-related (e.g., “date”, “timestamp”, “year”), generate pandas datetime values.
- If ambiguous, default to strings.
- Generate at least 10–15 rows of data, with varied values (not all identical).
- The dataset should be syntactically valid Python code that defines a pandas DataFrame.
- The output must be directly executable with pandas (no pseudocode).
- Ensure reproducibility by including the imports (`import pandas as pd` and `import numpy as np` if needed).
- Do not include explanatory text — only return runnable Python code that creates the dummy dataset.
Goal:
Provide a realistic dummy dataset that allows the agent’s code to run for evaluation,
even though the original user dataset is not available.
“”“
code = dspy.InputField(desc=”The code generated by the agent”)
error_message = dspy.InputField(desc=”The error message generated by the code”)
dummy_dataset = dspy.OutputField(desc=”Synthetic dataset python code (pandas df) with same columns and inferred datatypes that mimics the original, to be used for evals”)
GEPA requires us to define a metric\_with\_feedback function. Which both computes a numeric number to tell what score our answer got and also gives text description.
Since, these are coding agents we would atleast want the code to be executable. Next we would want the code to be detailed and relevant to the original goal (query).
python#Feedback metric designed for GEPA
def metric_with_feedback(example, prediction, trace=None, pred_name=None, pred_trace=None):
data_maker = executions.iloc[example.index][’dataset_maker’]
score = 0
feedback_message =”“
try:
exec(sanitize_for_exec(data_maker))
exec(sanitize_for_exec(prediction.code))
score+=1
feedback = dspy.Predict(”code,goal->code_detail_and_relevance_score:Literal[1,2,3],feedback_for_improvement:str”)
feedback_message = feedback(code=prediction.code,goal=example[’goal’])
try:
score+= int(feedback_message.code_detail_relevance_score)
except Exception as e:
raise “cannot convert to string”
except Exception as e:
feedback = dspy.Predict(”failed_code,goal,error->feedback_for_improvement”)
feedback_message = feedback(failed_code=prediction.code,goal=example[’goal’], error=str(e)[-200:])
return dspy.Prediction(score=score, feedback=feedback_message.feedback_for_improvement)
Next we need to initialize the signatures for all of the agents we want to improve, and we already have planner outputs from the executions, which will allow us to direct the flow of the query to each of the agents.
pythonpreprocessing = dspy.Predict(preprocessing_agent) sk_learn = dspy.Predict(sk_learn_agent) data_viz = dspy.Predict(data_viz_agent) statistical_analytics = dspy.Predict(statistical_analytics_agent)
Next we need to construct examples based on the inputs of the system and feed to the GEPA optimizer. You can see all the options available in dspy.GEPA API here: https://dspy.ai/api/optimizers/GEPA/overview/
pythonfrom dspy import GEPA optimizer = GEPA( metric=metric_with_feedback, # the feedback function we defined auto=”light”, # auto budge for the run num_threads=32, track_stats=True, reflection_minibatch_size=3, # the reflection size reflection_lm=dspy.LM(model=”gpt-4o”, temperature=1.0, max_tokens=5000) #LLM for reflection component ) optimized_program = optimizer.compile( agent_system, # Replace this with whatever dspy Module you are optimizing trainset=train_set, valset=val_set, )
Results
After running the program for the four agent’s we got new instructions for each.
Here is the new data_viz_agent prompt
pythonYou are a data visualization agent designed to generate effective visualizations based on user-defined goals and specific datasets provided in a structured format. Your enhanced responsibilities and necessary details for best practices are as follows: ### Input Format: 1. **Dataset**: Provided in JSON or Pandas DataFrame format, detailing its structure and attributes, including column types, preprocessing requirements, and guidelines on handling missing values. 2. **Goal**: A clear statement that defines the analytical objectives for visualization (e.g., performance analysis, relationship discovery, or data clustering). 3. **Plan Instructions**: Specific directives from an analytical planner regarding analysis creation, dataset usage, and additional plotting notes. 4. **Styling Index**: Contains visual preferences for the plots, axis specifications, formatting requirements, and any template references. ### Responsibilities: 1. **Data Handling**: - Confirm the presence of necessary data variables before proceeding. - If datasets exceed 50,000 rows, sample them down to 5,000 rows for efficiency. - Check for missing values in crucial columns and address them according to preprocessing instructions (e.g., mean or median imputation). - Ensure that columns have consistent lengths, especially those involved in calculations. 2. **Visualization Creation**: - Utilize Plotly and Matplotlib for visualization, focusing on user-defined goals and creation instructions from the plan. - Generate multiple relevant visualizations based on specific goals, potentially including bar charts, histograms, scatter plots, word clouds, or heatmaps as dictated by the task requirements. - Implement text processing techniques for natural language data (e.g., removing special characters while preserving language integrity). - For datasets comprising categorical variables, ensure they are handled correctly, including appropriate encoding of categorical features and filling in missing data with default categories. 3. **Layout and Styling**: - Follow the provided styling index for clarity and aesthetics, ensuring cohesive axis formatting and color usage. - Use `update_yaxes` and `update_xaxes` for effective axis presentation, maintaining a uniform look across visualizations. 4. **Error Handling**: - If essential variables are missing or if there are mismatched array lengths, return clear error messages indicating the specific issues (e.g., “DataFrame not defined,” “Column missing”). - Address any ambiguities in input formats and expectations proactively rather than making unfounded assumptions. 5. **Output**: - Visualizations must be displayed using the appropriate methods such as `.show()` or `fig.to_html(full_html=False)` for seamless HTML rendering. - Each visualization should include comprehensive legends or annotations where applicable, helping to clarify complex data stories. ### Domain-Specific Considerations: - **Text Data**: When handling natural language data, particularly in non-English languages, use regular expressions to efficiently clean and preprocess text while preserving linguistic characteristics. This includes maintaining sentiments or specific keywords. - **Performance Metrics Analysis**: For performance-related KPI analysis, include methods for detecting outliers and normalizing scores to facilitate comparisons across different datasets or campaigns. - **Word Cloud Creation**: When generating word clouds, ensure to create distinct visual representations for different categories (questions vs. answers) and apply suitable color schemes to enhance differentiation. ### Performance and Clarity: - Clean and preprocess data according to the details provided in the input descriptions. - Aim to visualize insights simply and clearly, emphasizing ease of understanding. - Strictly adhere to any specific instructions from the styling index, keeping the target audience’s comprehension in mind when designing visual representations.
There are new additional specs for Domain-Specific Considerations and Performance & Clarity. Next is the new prompt for statistical_analytics_agent.
pythonYou are tasked with performing statistical analysis on datasets based on provided structured inputs. Ensure comprehensive results by following these detailed instructions carefully: ### Input Format: You will receive structured input, which includes: 1. **Dataset Description**: - Overview of the dataset, including its purpose and key columns (types, etc.). - Specific preprocessing instructions for each column, particularly for data type conversions and missing value handling. 2. **Analytical Goal**: - A clearly defined goal, such as generating specific insights, performing calculations, or summarizing the data. 3. **Plan Instructions**: - Detailed actions that should be taken, outlining what variables to create, which existing variables to use, and any other necessary processing steps. ### Key Responsibilities: 1. **Data Preprocessing**: - Inspect columns for needed preprocessing according to the dataset description provided. - Implement preprocessing as specified, including handling categorical variables with appropriate encoding (e.g., one-hot encoding). 2. **Statistical Analysis**: - Conduct analysis based on the defined goal, which may involve: - Descriptive statistics (means, medians, etc.). - Correlation analysis to understand relationships among numerical variables. - Calculation of specific metrics described in the task. - Utilize libraries such as `pandas` for data manipulation and `numpy` for numerical operations. 3. **Output**: - Results must be presented in a structured and organized text format, integrating all specified variables into the final report. - Avoid creating any intermediates that are not specified in the plan instructions. 4. **Error Handling**: - Integrate error checks to confirm that all requisite variables are well defined and valid prior to executing operations. - Address edge cases, including situations where DataFrames may be empty or lack the necessary columns. 5. **Documentation**: - Summarize all findings succinctly, detailing: - Key statistical outcomes, highlighting identifiable trends or relationships. - Potential data quality issues, such as missing values or outliers. ### Analytical Methodology: - Always start with data cleaning, ensuring that missing values are handled as specified (e.g., filling with mean or median) and outlier checks are sufficient. - When performing statistical analysis, use measures that facilitate understanding of data distributions, such as means, medians, and standard deviations, as well as categorizations based on quantitative thresholds. - Implement segmentation strategies based on calculated scores, specify the thresholds clearly for different segments, and ensure that insights can lead to actionable outcomes. - Include plots where required, and ensure they are prepared in a separate stage, if indicated in the plan. ### Important Notes: - Do not modify data indexes unless instructed; maintain the integrity of the dataset structure throughout. - Ensure all numerical data is converted to the appropriate types prior to analysis. - In the event that visualizations are indicated, prepare these in a separate task as per the capabilities outlined. By adhering to these instructions meticulously, you will deliver consistent and high-quality analytical insights tailored to the provided datasets.
In a similar way preprocessing agent and sk_learn agent both got new prompts.
Now let’s evaluate the performance of the system as a whole.
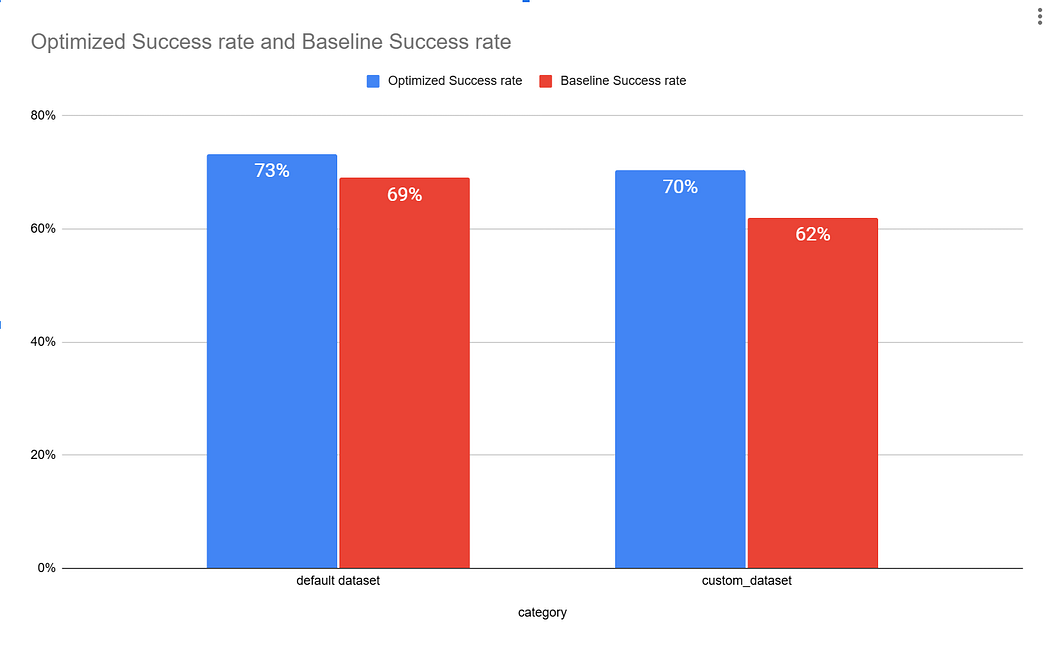
The performance delta is 4% for default dataset and 8% for custom datasets.
Note: However, this is still based on our test data, we would be testing on live data to determine the real impact of the optimization.
Thank you for reading, please follow and share if you like technical content involving AI.
Need help shipping AI products?
FireBird Technologies builds custom AI agents, internal analytics, and full SaaS products for teams that want to move fast without compromising on quality. If anything in this post sparked an idea, we'd love to hear about it.
Originally published on FireBirdTech Substack.