
Improving the AI data scientist, adding features based on user feedback
Updates to autoanalyst.ai

The autoanalyst is an open-source AI data scientist developed by Firebird technologies. The project was in live beta since May 14, 2025. As of writing this post ~900 people have signed up the beta version, with over 2,000 queries asked by our users.
Since our initial launch, we've been closely observing how users interact with the system to better understand where we can improve. While we don’t claim to have a full picture of every user's needs, some clear patterns have started to emerge.
In this post, we’ll highlight the latest features we've rolled out and share a glimpse into where the project is headed next.
Usage Patterns
After looking into the data (no pun intended) we found that the most common use for the product is visualizations. That fact did not seem to come as a surprise (we were expecting that) but what was unexpected was how much data visualization task’s dominate overall usage.
Our data suggests that more than 80% of queries requested visualizations explicitly!
So, in order to serve our user’s better we have added visualization-based features!
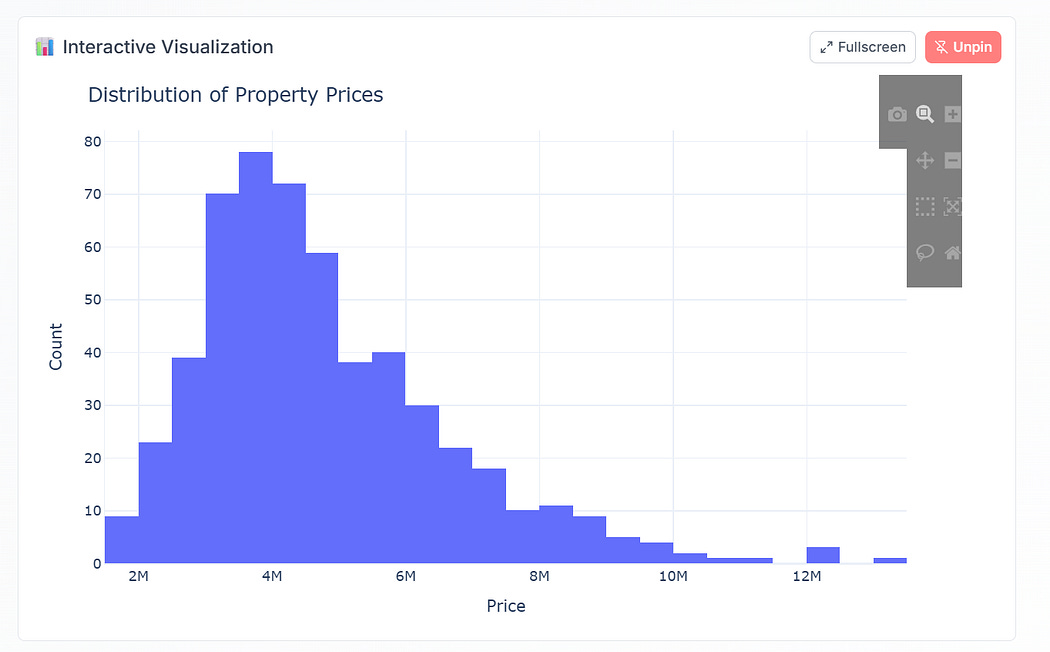
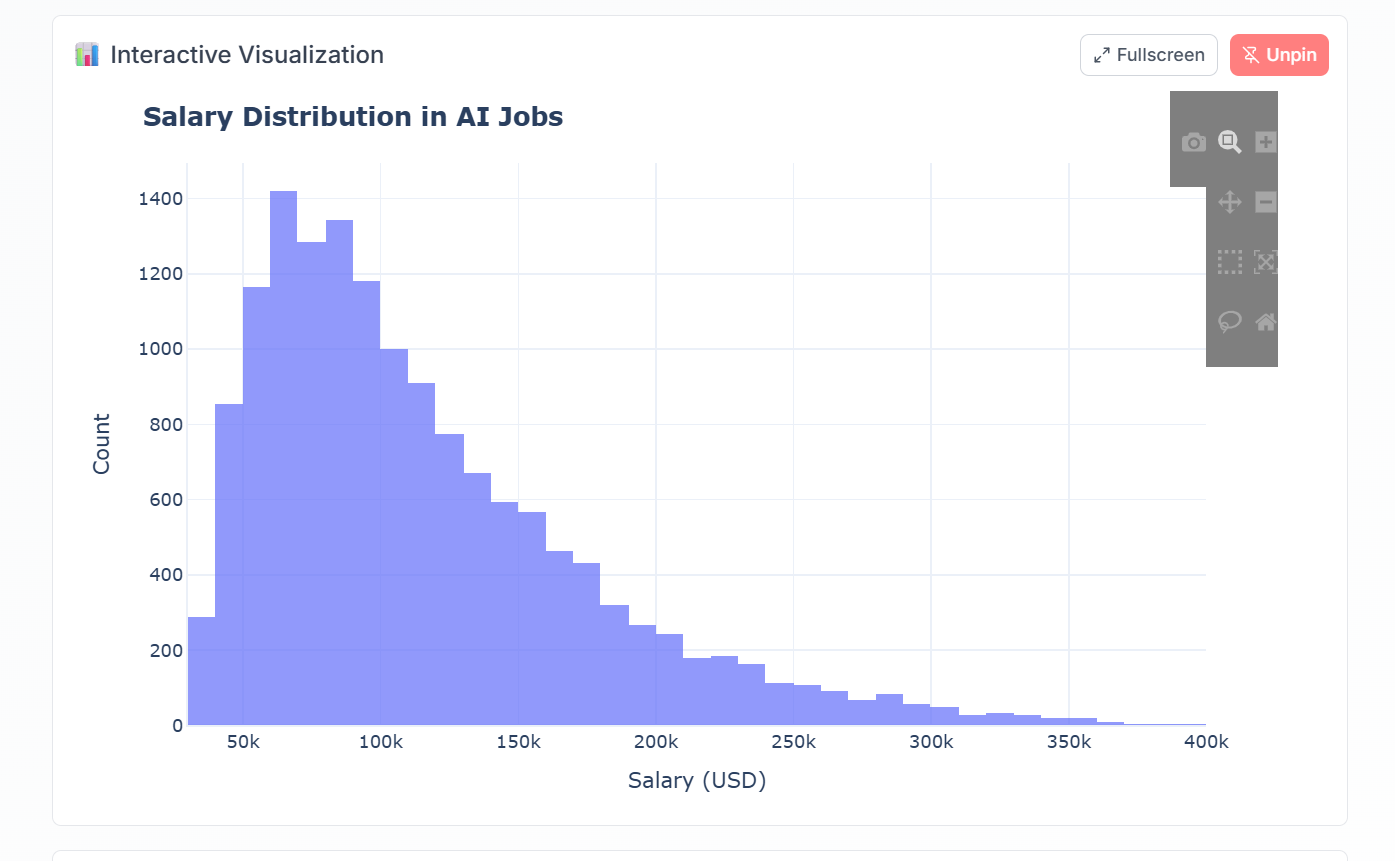
Many users complained that while they appreciated the visualizations generated by the system, they were unable to save them or view them in full-screen mode. Users also wanted to compare different & contrast different charts for analysis.
Need a builder that is in the trenches like you? I provide AI development services to clients. So far have done 13+ engagements with scrappy startups to MNCs.
Reach out here: https://tally.so/r/3x9bgo
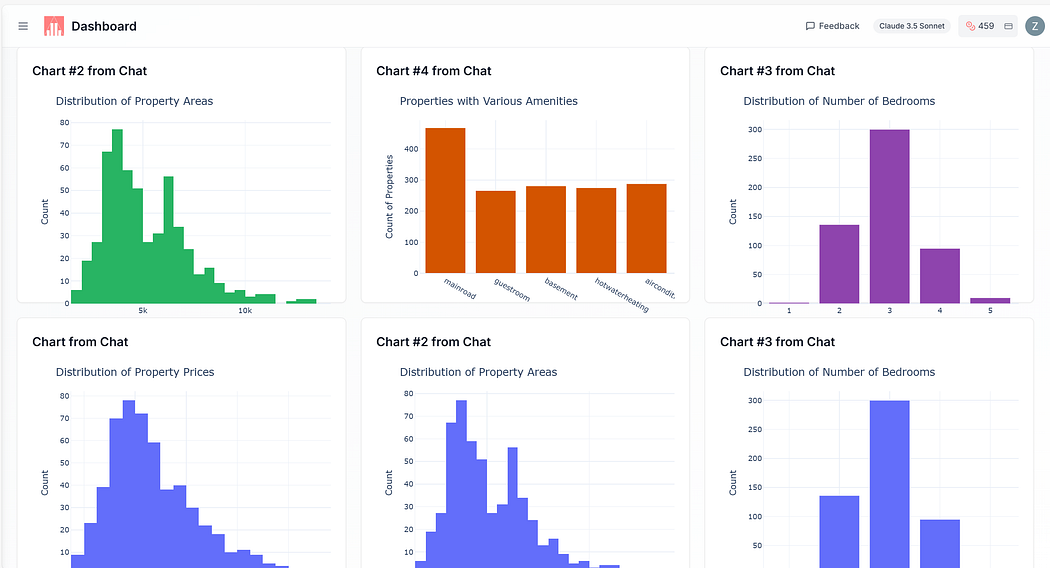
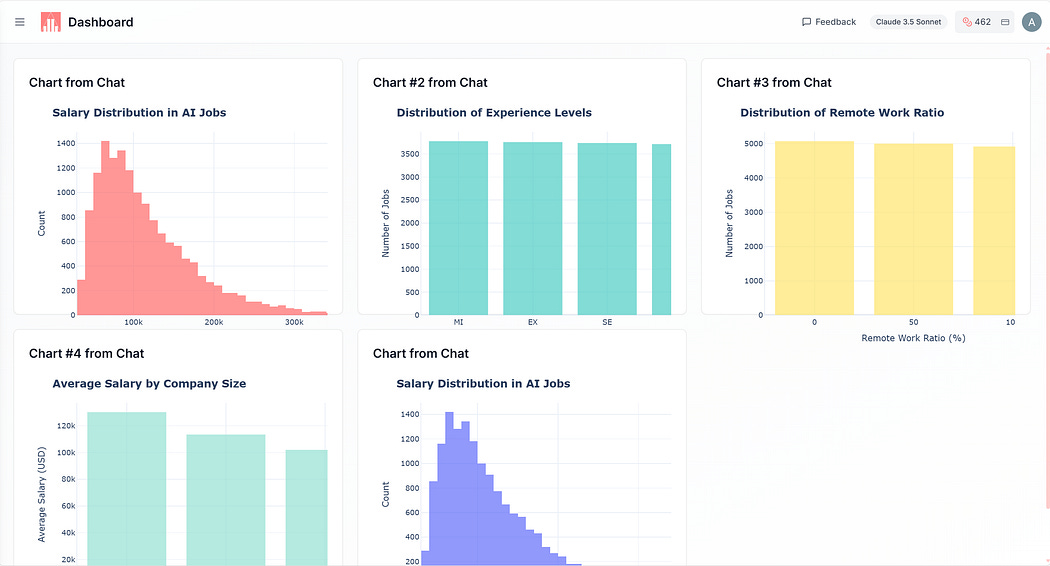
To make things easier, we’ve added a full-screen view option so you can focus on your charts without distractions. There’s also a new Dashboard view in the sidebar, where you can quickly pin any charts you want to save or compare later.
On the backend, we’ve made a big upgrade to our planner system; it’s now much more likely to recommend the visualization agent, helping user’s “see” the analysis they are doing.
Overall, directionally we will make visualization’s the most polished & refined feature of the product.
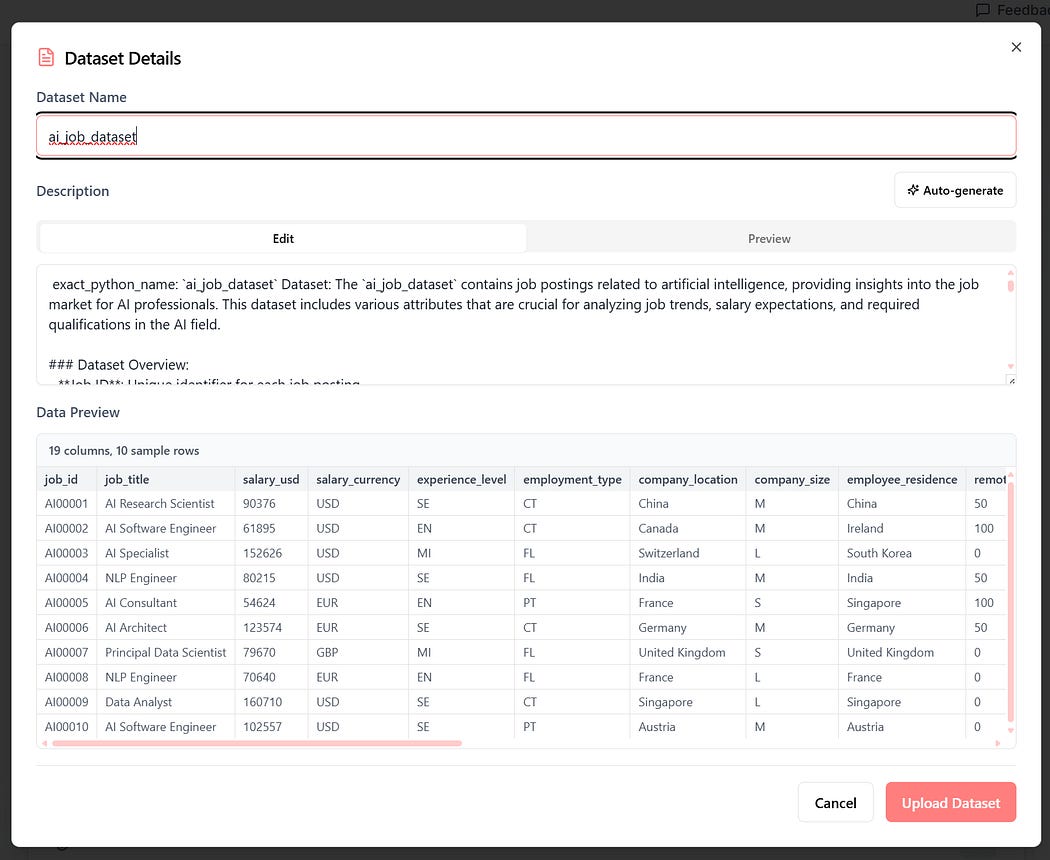
Multi-Sheet support for Excel
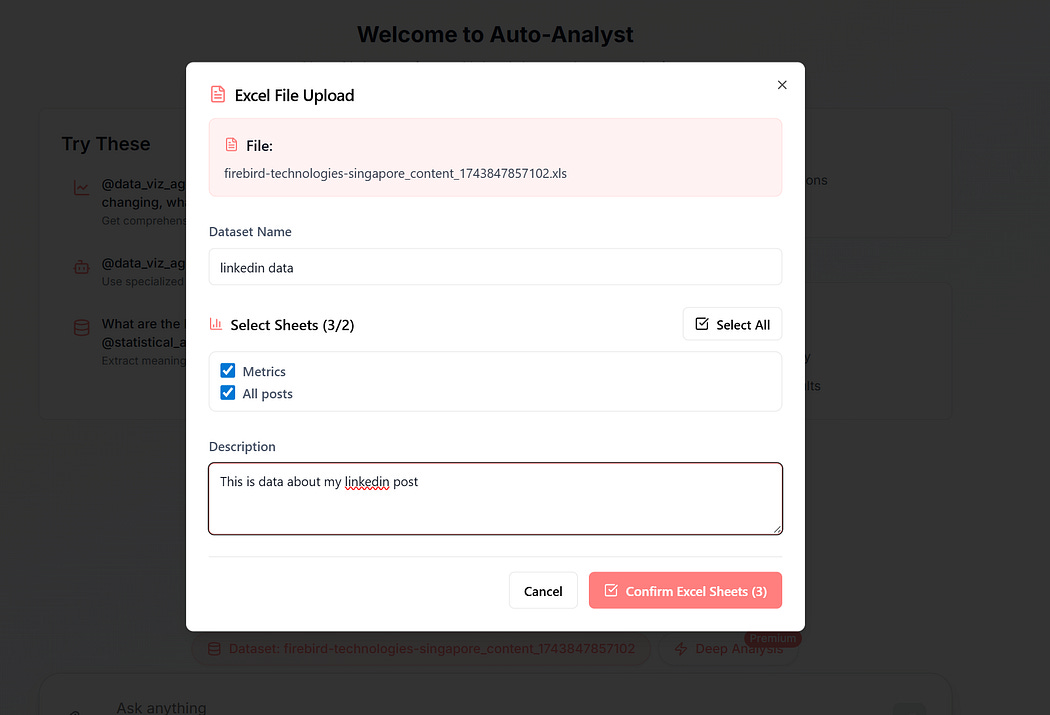
We’ve added support for multi-sheet simultaneous analysis! The system now automatically builds the context needed to make everything work smoothly.
From there, the planner decides which datasets to use for each query and gives clear instructions to each agent on how to handle their part.
Polished UI
Here are some improvements we made to the UI

Also, the dashboard view, where you can view all your pinned charts
Future direction
The project has come a long way from the start. A few months back it was just a streamlit app.
While we’ve made great progress, there’s still a lot more to do. We’re committed to learning from our users and continuously improving the experience. If you have thoughts or suggestions, we’d love to hear them — just use the feedback tab at the top of the screen to share your input anonymously.
Based on the data and feedback we’ve gathered, here are some of the key features we’re planning to add next:
A notebook-style interface to complement the current chat-based setup.
Better visualization tools, including the ability to share charts directly on social media.
More responsive and reliable AI performance. Building with LLMs is challenging — especially when it comes to balancing reliability and cost. We’ve already fixed many issues, but there’s more to address, and we’re focused on making the experience as smooth and dependable as possible.
Additional data connectors. Right now, the hosted version supports only CSV and Excel files, but we’re working on expanding that. For enterprise customers, our on-prem deployments already support custom connectors.
Need a builder that is in the trenches like you? I provide AI development services to clients. So far have done 13+ engagements with scrappy startups to MNCs.
Reach out here: https://tally.so/r/3x9bgo
Stay tuned — there’s a lot more coming!